
Bloomberg Globe
A browser-based globe for visual narratives created in collaboration with Lisa Strausfeld for BloombergView.
Climate Change in Perspective

Bloomberg View wanted a one-of-a-kind web experience for a major climate editorial. They turned to Cousins & Sears to bring it to life. Our ability to engage throughout the process was critical. The entire team, from editorial to design to technical, worked together to help shape the story and craft this unique platform for telling it.
The visualization is anchored to one object: an abstracted planet Earth. As the story progresses, you are guided to the relevant region. The next portion of the narrative appears. Data and images are presented in context. At times, the user is able to take control of the visualization but the next forward click smoothly guides them back to the narrative.
This is a user experience convention that we use frequently: guided walkthrough of interactive visualization. It lets users experience the possibility of interactivity without overwhelming them with it. It allows camera angles and other aesthetic properties to be carefully controlled. However, it also preserves a dynamic sense of exploration that is only created through interactivity. Varying degrees of user control vs. guided narrative are suitable depending upon your story and audience.
Just a few years ago, this experience would have been impractical for a mainstream media outlet to publish on the web. It would have been too slow, too costly to build and would have only been accessible from a few select browsers. Today most users can seamlessly access this level of interactive media. This product uses a slideshow for mobile because of design and development time constraints, but most modern mobile devices are fully capable of executing this kind of web-based experience.
This creates a tremendous opportunity in the constant competition for attention, and not only for media outlets. Organizations from financial companies, industrial producers, automakers, government agencies and beyond have data stories to tell to the public and to communicate internally. We'd love to talk about how you can tell yours.
PROJECT CREDITS
Writer & Researcher: Alex Bruns, Bloomberg View
Creative Director & Designer: Lisa Strausfeld, Bloomberg View
Design & Development: Jonathan Cousins & James Nick Sears, Cousins & Sears
Product Director: David J. Harding, Bloomberg View
Below are some images and video of the experience, but you should try it for yourself.
Video and Screenshots
Climate Change Visualization for Bloomberg View from James Sears.

An example of a photographic image appearing at the geographic location where it was originally taken.

Actual NASA data about glacier coverage plotted in 3D space.

Data about sea level rise combined with data about the ultimate impacts.

CO2 levels visualized extruding from the surface.
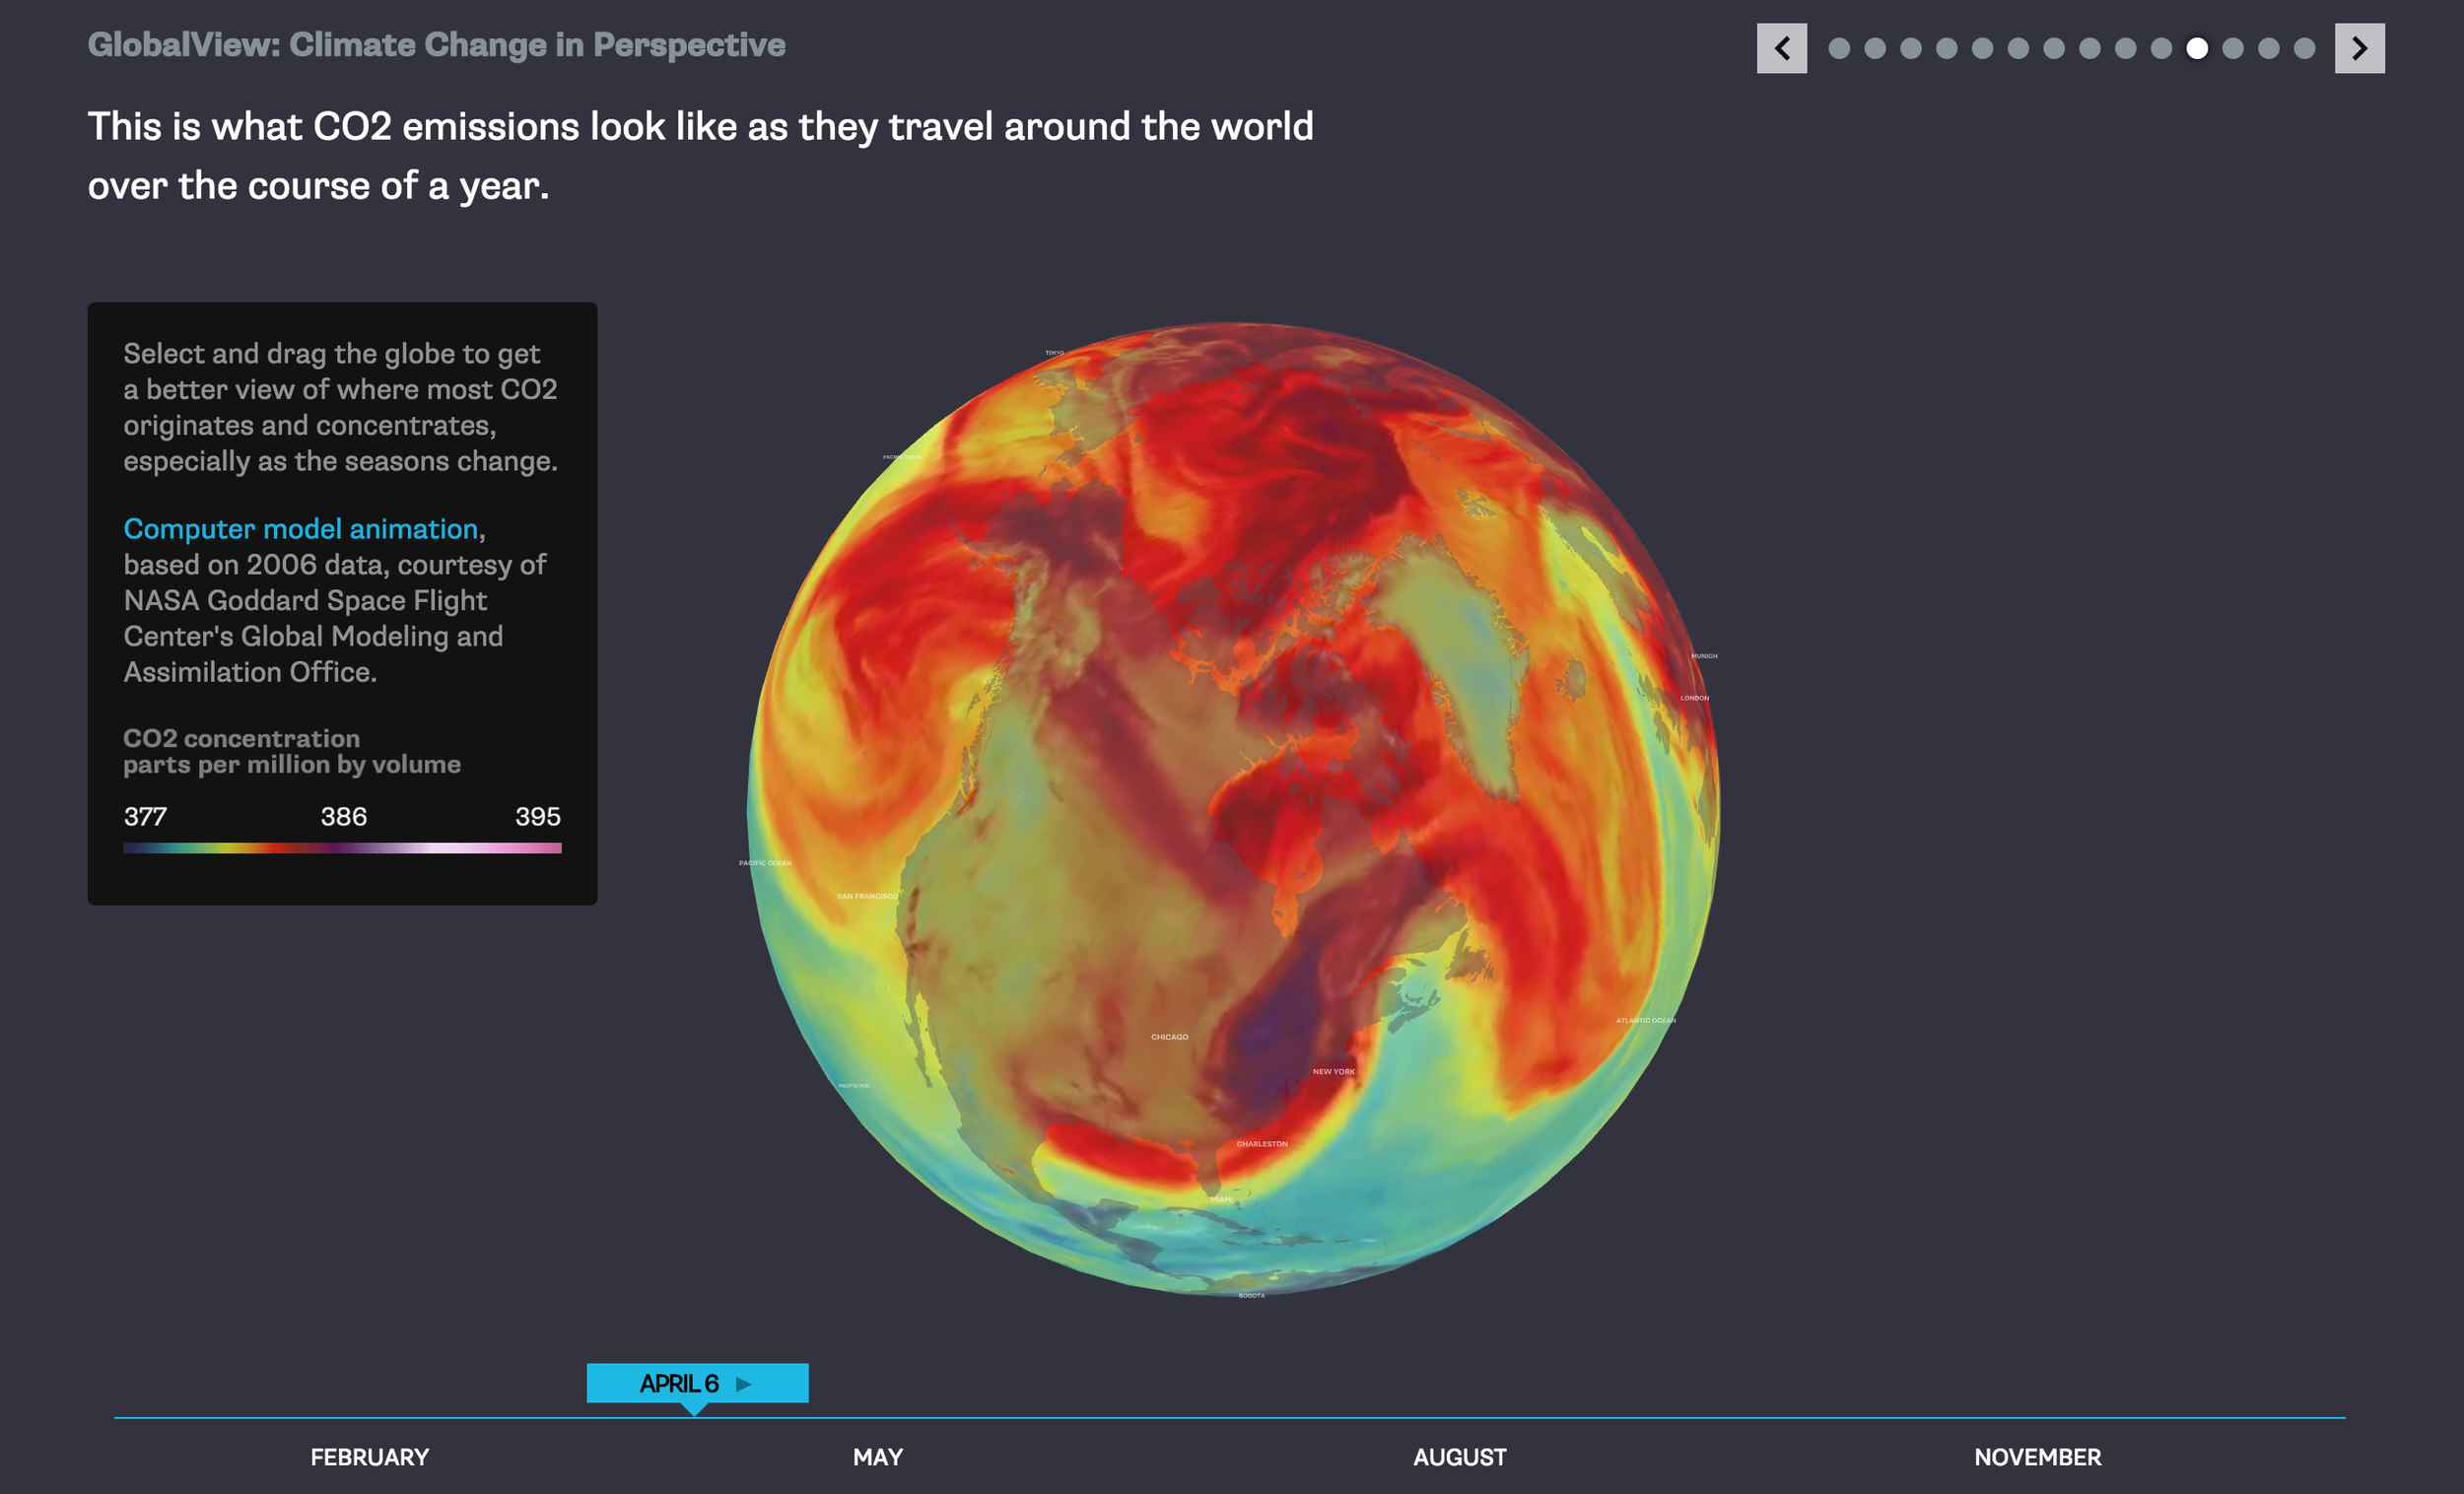
Before being added to the globe, this started as a flat 2D video. It was a NASA visualization on CO2 emissions traveling around the earth during a single year. We re-mapped the 2D video to our 3D globe in order to emphasize more than just east-west travel of CO2, which is what happens on flat maps. In this case, it’s much more clear how CO2 emissions are a single system affecting everyone.