
U.S. House of Representatives
iPad visualization for the Committee on Natural Resources showing U.S. energy consumption over the last 40 Years.
Context
The Democrats of the House Committee on Natural Resources commissioned this piece to visualize U.S. energy production and consumption over a 50 year period starting in 1960.
Called "eVIZ" for short, the application uses data from EIA's State Energy Data System (SEDS), which users can visualize in two modes, map and graph. Each of the two modes is designed to emphasize different characteristics of the data.
During the design and development period for the app, the ranking member was Edward Markey, who won John Kerry's seat as he assumed his position as Secretary of State.
Map Mode
In map mode, users view amounts of change in consumption or production based on geographic location, which helps put into perspective often salient, secondary factors, such as land area or climate.

Graph Mode
In this mode users look at exactly the same slice of data, but states sort themselves according to additional statistics such as population.
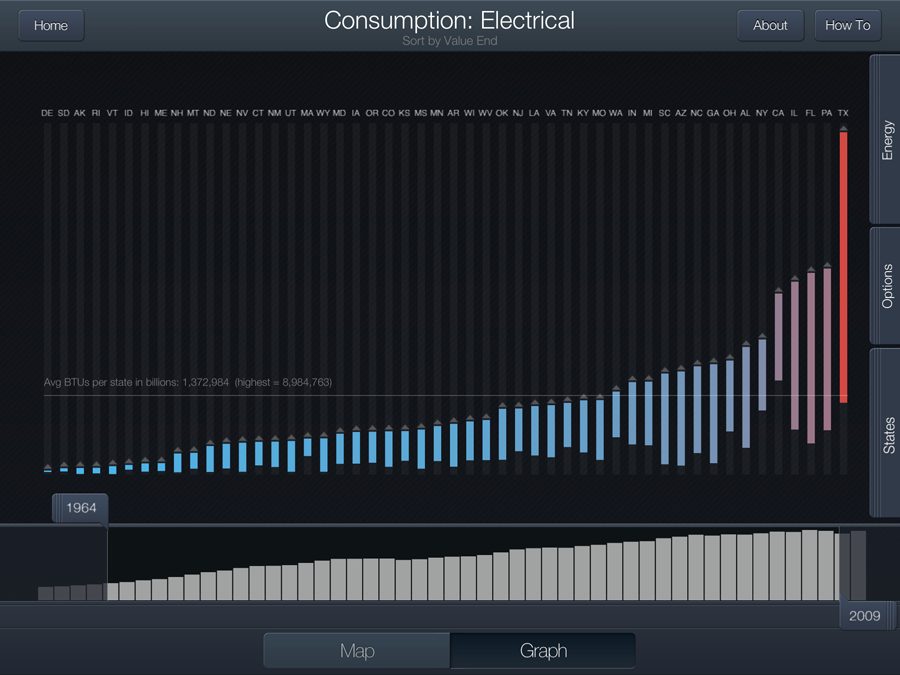
Timeline Sliders
For both Map and Graph users can set a time period to visualize by adjusting a pair of sliders along a 50-year timeline at the bottom of the screen. Along the timeline itself are plotted national averages by-year for the consumption or production data that the user has selected.

Additional Features
The app has a variety of additional features such as a fuel efficiency calculator and a map of extreme weather occurrences during the five year period before the app was released.

